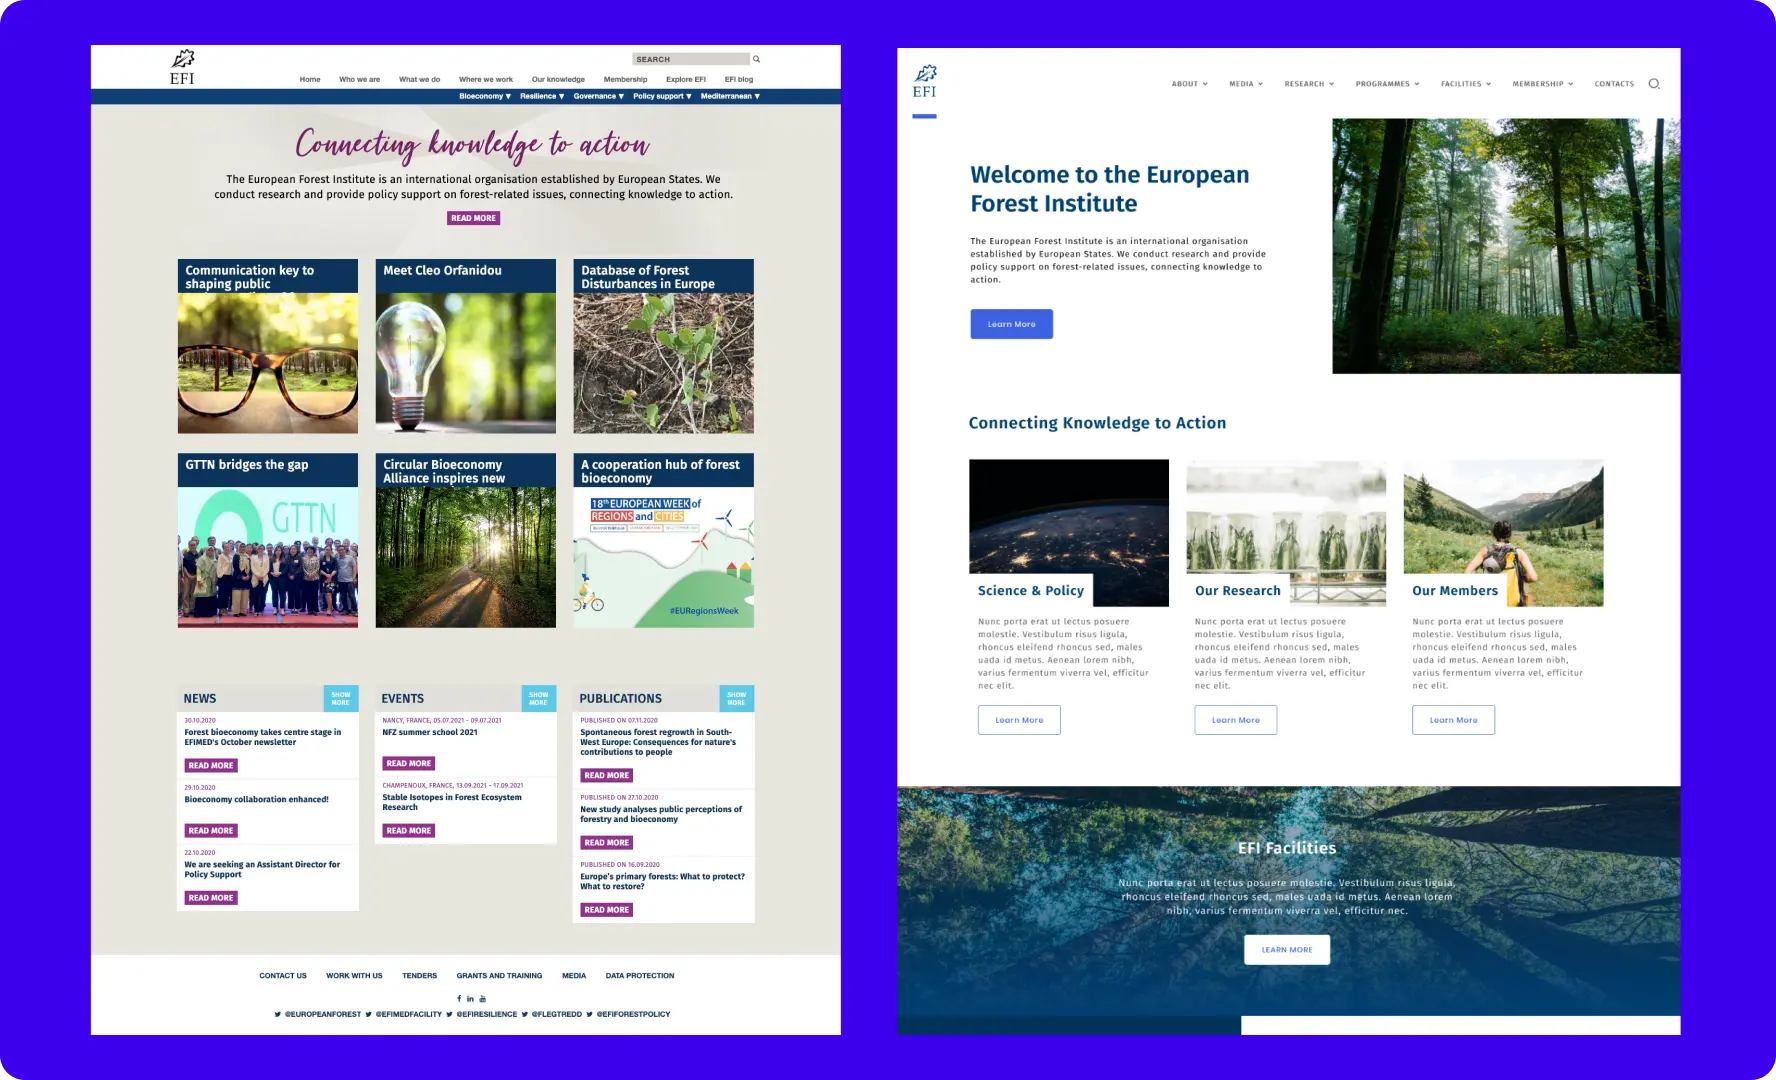
The next important step of this analysis was to understand the users’ behaviour inside the EFI website. Looking into having a more realistic idea of user experience on the website we dove into Google Analytics.
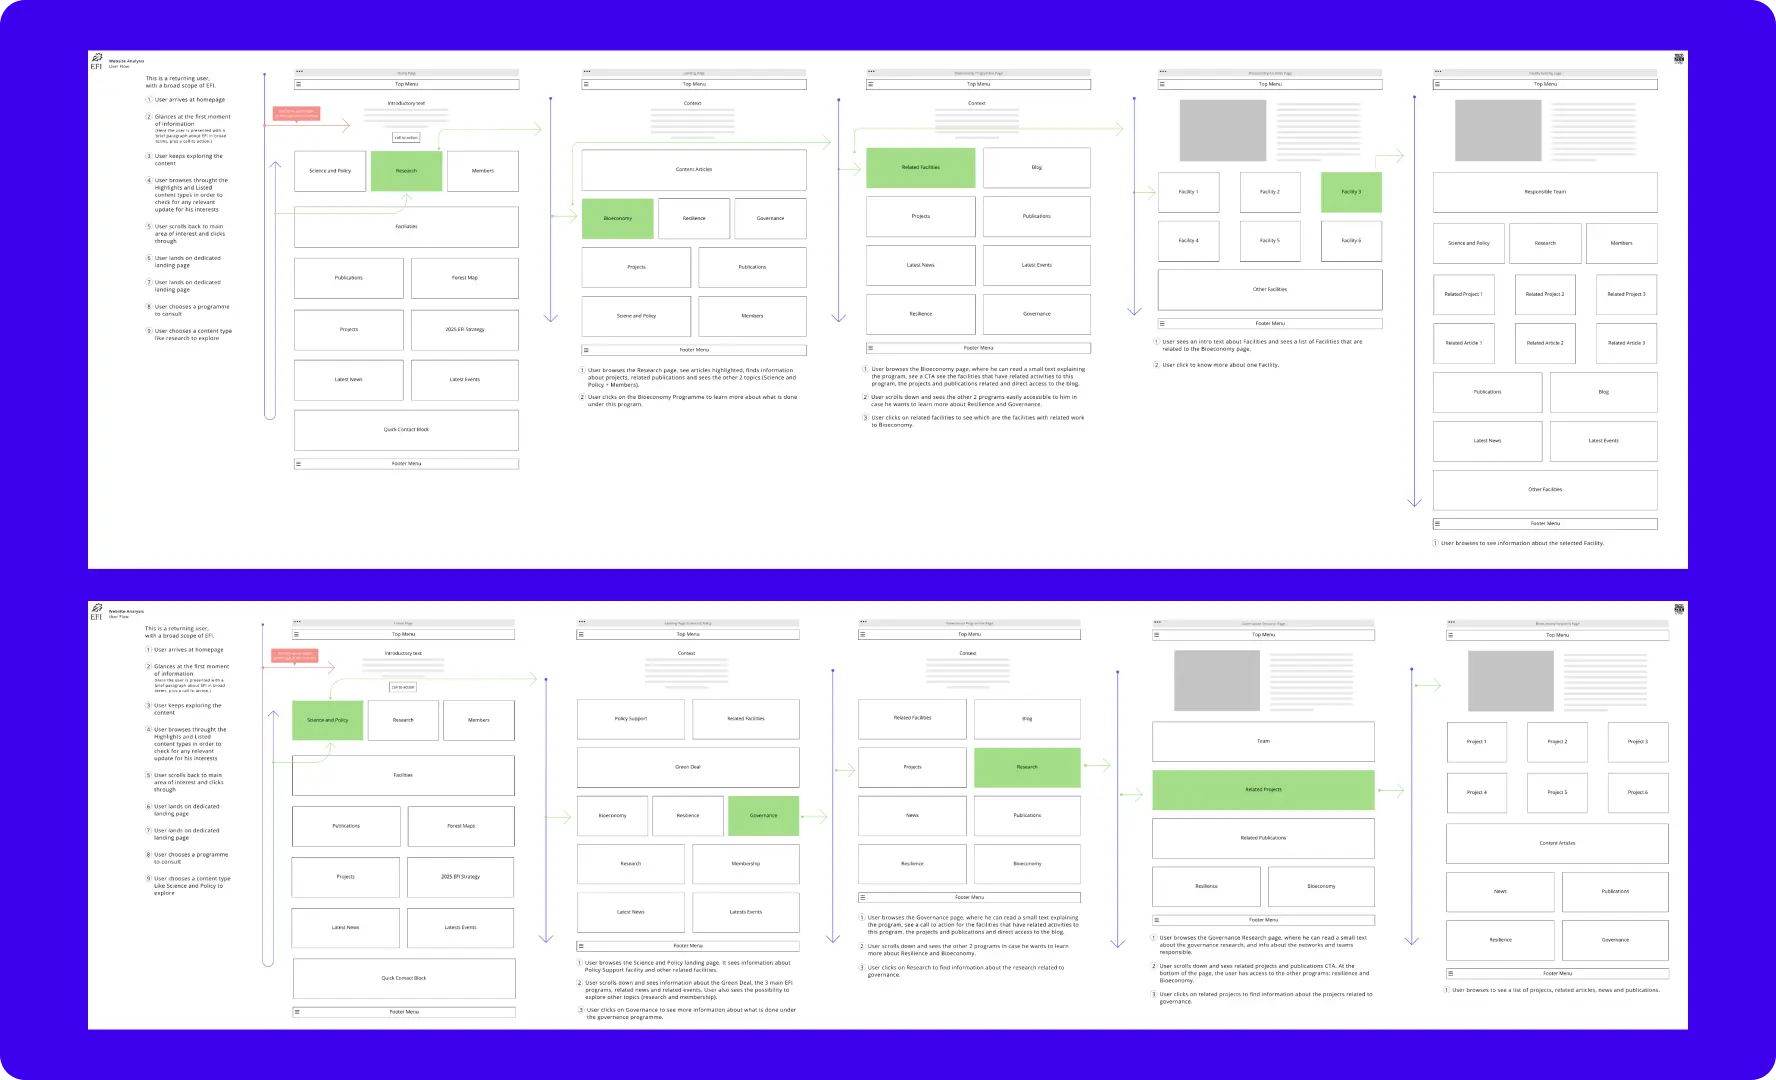
We were able to identify which were the main visited pages, the ones with a higher bounce rate, user journeys inside the website, time in pages and general user engagement.
With this analysis, we had a more clear idea about the pages that needed more attention from a UI/UX point of view and which information should go to the homepage aiming to increase user engagement on the website.
For instance, we've noticed at this stage that the News page had a very high bounce rate, which could be explained by the fact that people were right away clicking on the top of the page article, meaning that they were not exploring other articles and news.
